1. Introduction
Histograms are a statistical tool used in a variety of fields, including data analysis, quality improvement, and market research. They provide a visual representation of the frequency distribution of numeric data sets, highlighting where most of the values lie within a data set: whether towards higher or lower ends, or somewhere in the middle. In our data-driven, information-rich world, being able to efficiently and accurately create histograms is becoming increasingly important.

1.1 Importance of Histogram Maker tool
Histogram Maker tools take the burden of manual calculations and graphical representation out of the equation, helping to streamline the analysis process. They can automatically sort raw data into various bins or ranges, and generate a user-friendly diagram that displays the information in an easily digestible form. With Histogram Maker tools, professionals can enable quicker, more informed decision-making based on their data.
1.2 Fix Excel Files
A histogram is a commonly used chart in Excel. Moreover, you also need a great tool to fix Excel files when they are damaged. DataNumen Excel Repair is a perfect one:
1.3 Objectives of this Comparison
The objective of this comparison is to provide an overview and evaluation of some of the current histogram maker tools available in the market. We will assess each tool on a set of different metrics, including their usability, functionality, and pricing, among others. The result will be a comprehensive guide that can help professionals select the best tool for their specific needs. This comparison aims to save professionals time on research, and lead them straight to the most suitable tool for their requirements.
2. Visme’s Histogram Maker
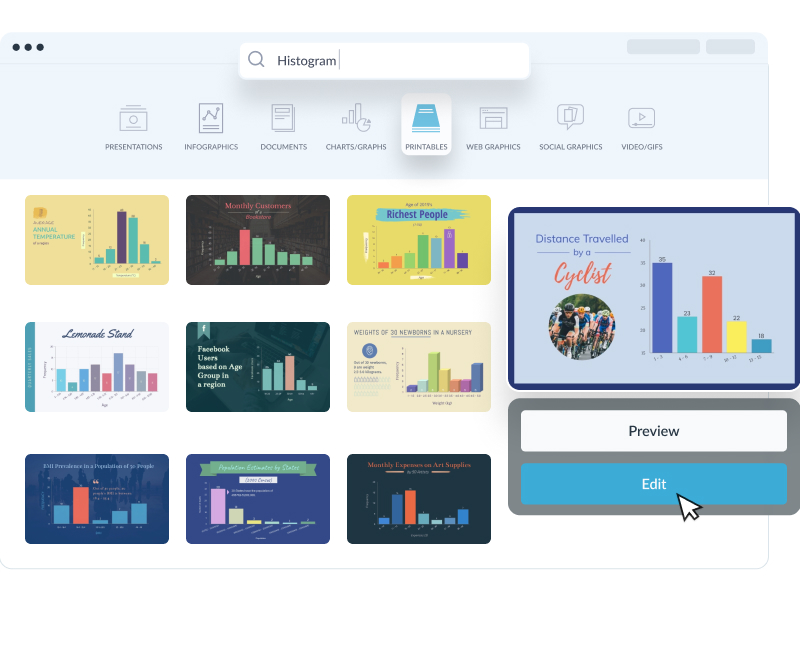
Visme is a full-featured graphical tool primarily used for creating infographics, presentations, and other visual content, but it also comes equipped with a Histogram Maker. The tool allows users to turn complex data into beautiful, easy-to-understand visuals. Users can customize their histograms with Visme’s easy-to-use interface.
2.1 Pros
- Ease of use: Visme’s Histogram Maker has a user-friendly interface, making it easy for users with any level of experience to navigate. The drag-and-drop functionality simplifies the process even further.
- Customization: Visme offers a wide variety of customization options, including color schemes, text styles, and sizes, enabling the development of histograms that fit perfectly with your branding.
- Interactivity: One unique feature of Visme is its interactivity. Users can create an interactive histogram that viewers can engage with, adding another layer to data analysis and representation.
- Integration: Visme supports the integration of live data, meaning that the histograms can update automatically when the data source is updated.
- Data Import: The Data import feature allows ease of importing data using CSV or Excel files, saving users from manual entries.
2.2 Cons
- Pricing: While Visme does offer a free version, it’s quite limited. To fully unlock the tool’s potential, users have to pay for a premium plan.
- Limited to Histograms: Using Visme, the scope for creating statistical graphs is limited to histograms. Other specific statistical charts like box-plot, scatterplot are not possible with this tool.
- Slow with large datasets: While Visme can handle smaller datasets with ease, users do report performance issues when trying to create histograms from larger datasets.
3. Someka Histogram Maker Excel Template
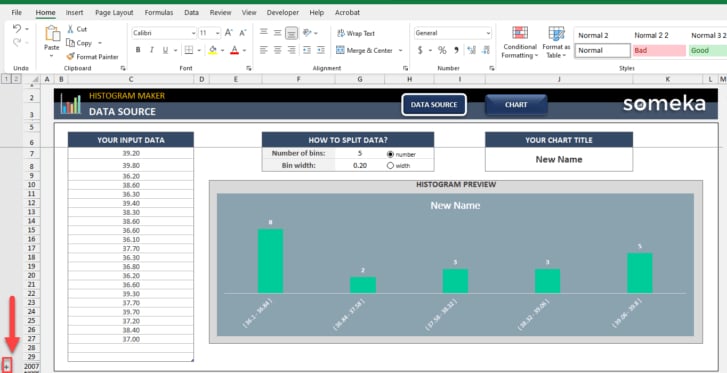
The Someka Histogram Maker is an advanced Excel template designed to simplify the creation of histograms. It leverages Excel’s built-in capabilities and user familiarity with the Excel environment to deliver a seamless histogram creation experience.
3.1 Pros
- User familiarity: As an Excel-based tool, Someka leverages an environment that many users are familiar with, making it easy to get started, even for beginners in statistical analysis.
- Automation: Someka automates many of the steps in creating a histogram, such as bin calculations, reducing the potential for errors and saving time for the user.
- Affordability: Compared to specialized visualization software, Someka offers a cost-effective solution for creating histograms.
- Compatibility: Since it is a Microsoft Excel-based tool, it has high compatibility with other MS Office tools like PowerPoint, Word, etc. for reporting and documentation purposes.
3.2 Cons
- Limited customization: The extent of customization possible with Someka’s Histogram Maker is limited to those allowed by Excel itself, which may not be as extensive as those offered by more specialized tools.
- Dependency on Excel: Someka’s Histogram Maker is built completely on Excel. It will not work if the user does not have Excel installed, adding a potential barrier for a section of its potential user base.
- No live data integration: With Someka’s Histogram Maker, automatic updates using live data source are not available. This could be an issue for projects requiring real-time data representations.
4. QI Macros Histogram Maker
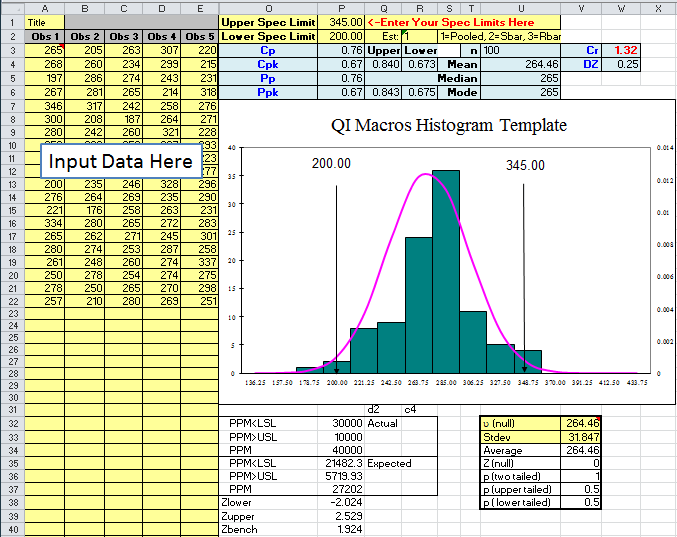
The QI Macros Histogram Maker is an Excel add-in that is designed to provide advanced histogram creation capabilities right within Excel. This tool is a part of the QI Macros Suite that includes over 40 other Six Sigma tools and statistical tools, making it particularly useful for users involved in quality improvement projects.
4.1 Pros
- Overcomes Excel limitations: QI Macros Histogram Maker improves upon the existing histogram capabilities within Excel, addressing several of its limitations, such as inability to easily refine bins and to add horizontal lines detailing specification limits.
- Quality tools included: With the QI Macros Suite, users get access to over 40 other Six-Sigma and statistical tools which can be highly beneficial for quality professionals.
- Automates analysis: QI Macros Histogram Maker can automate the process of selecting the right type of histogram based on the data provided.
- User-friendly: The tool can be easily integrated into Excel and all its functionalities are quickly accessible within the Excel tab after installation.
4.2 Cons
- Pricey: Compared to other histogram tools, the QI Macros suite is on the expensive side.
- Excel-dependence: Like Someka, this tool is also Excel-dependent and would not work if the user does not have Excel installed.
- Limited Support: The customer support for QI Macros has received mixed reviews, with some users reporting slower response times.
- No free version: There is no free version of the QI Macros suite, meaning all users must purchase the software in order to utilize it.
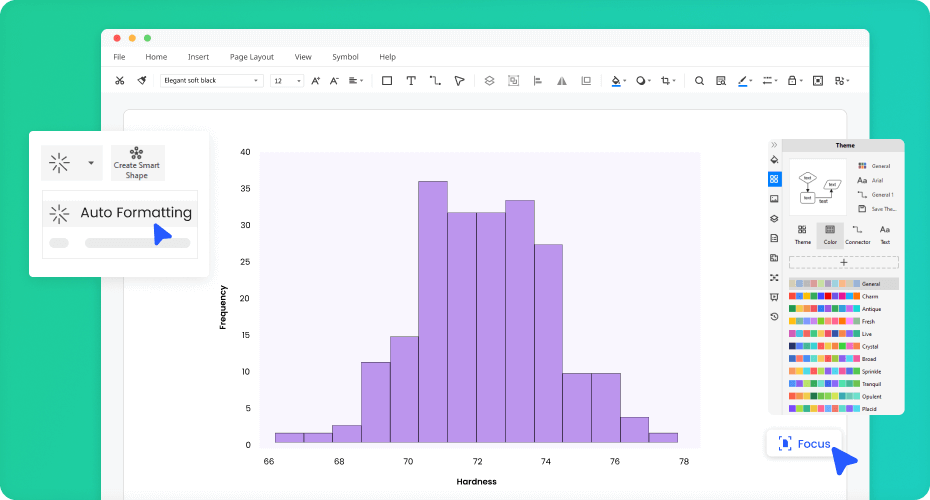
5. EdrawMax Histogram Maker
EdrawMax is a versatile diagramming software that offers a range of tools for creating various types of charts, including histograms. The Histogram Maker in EdrawMax comes with a broad array of customization options that can be used to make the histogram more visually appealing and informative.
5.1 Pros
- Versatile tool: Apart from histograms, users can create various other types of statistical charts like dot plots, box plots, scatterplots, etc. with EdrawMax.
- Abundant templates: EdrawMax provides a large number of premade templates that can accelerate the histogram creation process. These templates can also be customized to the user’s preferences.
- High level of customization: EdrawMax offers advanced customization options, including the ability to add different shapes, texts, backgrounds, and border styles to the histogram. This allows users the flexibility to create unique and personalized visuals.
- Supports multiple file formats: Histograms created with EdrawMax can be exported in a range of formats, including PDF, PPT, Word, JPEG, etc. which makes it versatile for sharing and reporting.
5.2 Cons
- Cost: EdrawMax’s premium features are available only in its paid version. While the software does have a free version, its functionality is limited.
- Complex for beginners: While EdrawMax offers a broad array of powerful charting tools, it may be a bit complex for first-time users or those with less technical prowess.
- No live data integration: Like many other histogram tools, EdrawMax does not support live data integration.
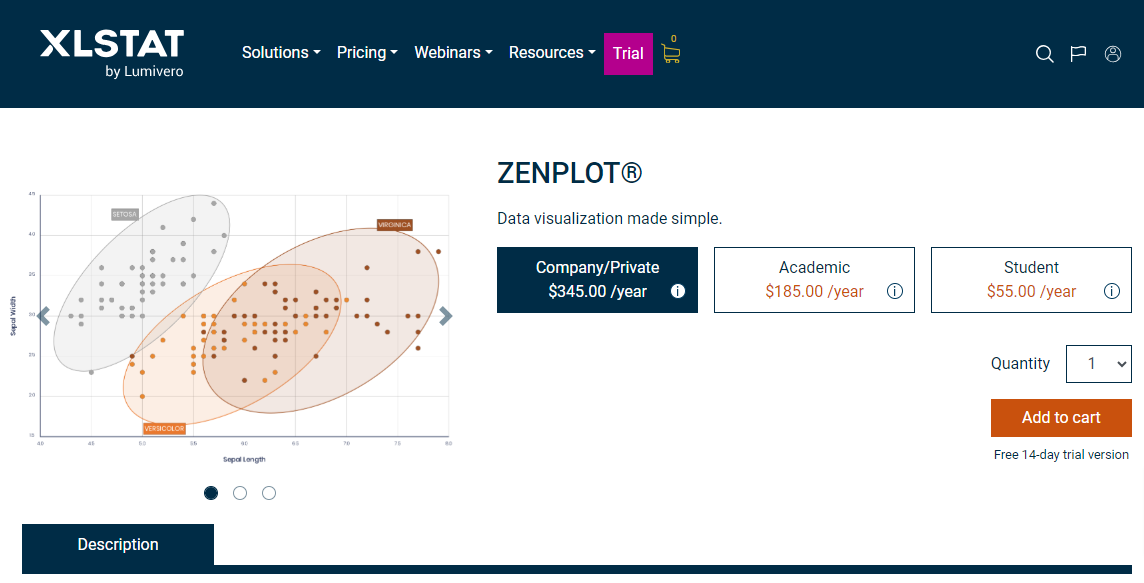
6. ZENPLOT
ZENPLOT is a comprehensive data visualization software that offers a multitude of features for rendering data into engaging, useful visuals, including histograms. It allows for the creation of multiple layers within the same graph, each of which can represent different data, in different formats, making it possible to create detailed and expressive visuals.
6.1 Pros
- Multi-layer Plots: ZENPLOT’s multi-layered plotting feature allows users to overlay multiple data sets onto a single graphic, enhancing the depth of data analysis and visualization.
- Wide range of graphs: Apart from Histograms, ZENPLOT can create a wide array of complex charts like heatmap, area chart, donut chart, etc.
- Annotation capabilities: ZENPLOT allows users to annotate their graphs, enhancing their communicability and making them more user-friendly.
- Customizability: The tool offers a high level of customization, providing a plethora of options for changing colors, sizes, axis range, and more.
6.2 Cons
- Pricing: ZENPLOT is a premium tool, and while it offers a range of advanced features, its pricing can be prohibitive for smaller-scale users or those with tight budgets.
- Steep learning curve: ZENPLOT is a complex, comprehensive software which may be challenging for new or less experienced users to navigate.
- Limited compatibility: Charts created in ZENPLOT may not be fully compatible with other software suites, which can restrict their use in some cases.
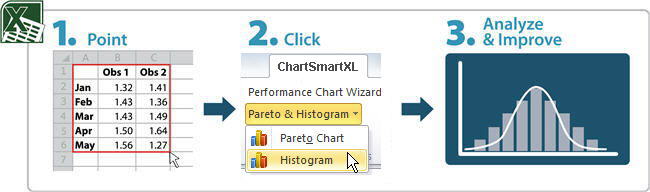
7. ChartSmartXL
ChartSmartXL is an add-in for Excel that simplifies the process of creating professional-looking business graphs, including histograms. It is specifically built to integrate seamlessly with Excel, enabling businesses to leverage the power of Excel for advanced data visualization.
7.1 Pros
- Excel Integration: As an Excel add-in, ChartSmartXL seamlessly integrates with Excel, making histogram creation a breeze for users already familiar with Excel’s interface.
- Template options: ChartSmartXL provides a variety of templates that speed up the process of creating a histogram and assure a professional look.
- Automation: This tool automates time-consuming tasks like formatting, labeling and error-checking, enhancing productivity and reducing the chance of errors.
- Customization: Like many other histogram maker tools, it also provides customization options for color, size, text style, etc.
7.2 Cons
- Excel Required: ChartSmartXL requires that users have Excel installed on their computers, which may not always be the case, especially with companies using other spreadsheet software.
- No free version: There is no free version available for ChartSmartXL, which may limit the initial accessibility for users.
- No live data integration: ChartSmartXL does not support live data integration, which could affect its usability in projects that require real-time data updates.
8. Origin
Origin is a comprehensive data analysis and graphing software used by thousands of engineers and scientists for producing high-quality graphs and analyzing data. The platform offers an easy-to-use interface for creating highly customizable histograms along with a broad range of other graphing options.
8.1 Pros
- Robust graphing capabilities: Origin offers a vast range of chart types including histograms, allowing for a high degree of customization to meet unique requirements.
- High precision: Origin provides high-precision measurements, making it a favored tool in research and industry scenarios that require exact values.
- Data analysis suites: Along with histogram-making capabilities, Origin also offers features such as statistical analysis, signal processing, and curve fitting, making it a comprehensive software for data scientists.
- Batch Processing: Origin supports batch processing, thereby saving considerable time when dealing with large datasets.
8.2 Cons
- Cost: Origin is relatively expensive compared to other histogram tools. The high cost may deter small businesses or individual users.
- Complex interface: The interface of Origin, while powerful, is not necessarily user-friendly for beginners. The steep learning curve may deter new users.
- System requirements: Origin is a heavy software demanding relatively high system requirements. Lower-end systems may struggle to run it smoothly.
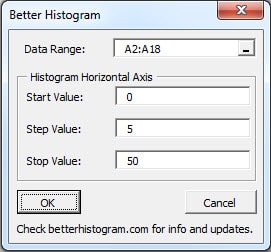
9. Better Histogram Add-in
Better Histogram is an Excel Add-in offered by TreePlan. The tool is specifically designed to enhance the limited histogram capabilities in Excel. It boasts features such as an automatic selection of bin width and number, providing a sophisticated solution for users seeking to create better histograms within the familiar framework of Excel.
9.1 Pros
- Automatic Bin Calculation: One of the key features of Better Histogram is its automatic calculation of bin width and number, simplifying the process and decreasing the chances of errors.
- User-friendly Interface: It effortlessly integrates with Excel, providing a user-friendly interface and intuitive tools, making histogram creation simpler for users already familiar with Excel.
- Value for Money: Compared to standalone software, Better Histogram offers an affordable solution to users looking for advanced histogram capabilities within Excel.
9.2 Cons
- Excel Dependence: Similar to other Excel add-ins, Better Histogram also requires Excel to run. It may not be suitable for users who do not use Excel.
- Limited Customization: The customization options available in Better Histogram are limited to those offered by Excel, which might not satisfy users looking for more customization capabilities.
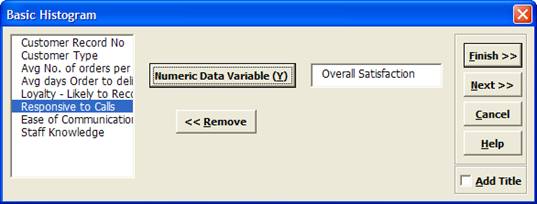
10. SigmaXL
SigmaXL is an Excel add-in, designed specifically for statistical and graphical analysis. It offers a wide range of functionalities, including the creation of histograms. The tool is regularly employed in Six Sigma and other data-intensive methodologies, making it a preferred choice for professionals engaged in extensive data analysis.
10.1 Pros
- Depth of features: SigmaXL offers a rich feature-set that goes beyond histogram creation, such as statistical tests, measurement system analysis, and more, providing a comprehensive toolkit for data analysis.
- Integration with Excel: Being an add-in for Excel, SigmaXL leverages the widespread use and familiar interface of Excel, making it accessible for a wide range of users.
- User-support: SigmaXL has robust user support, including a variety of tutorials and guides to help users capitalize on all its features.
10.2 Cons
- Learning curve: The extensive functionalities of SigmaXL may require a learning curve, especially for non-technical users or those unfamiliar with statistical analysis.
- Cost: SigmaXL is not free. The cost may pose a challenge for small businesses or individual users with tight budgets.
- Dependency on Excel: Similar to other add-ins, SigmaXL is dependent on Excel and may not be suitable for users who lack access to Microsoft’s spreadsheet software.
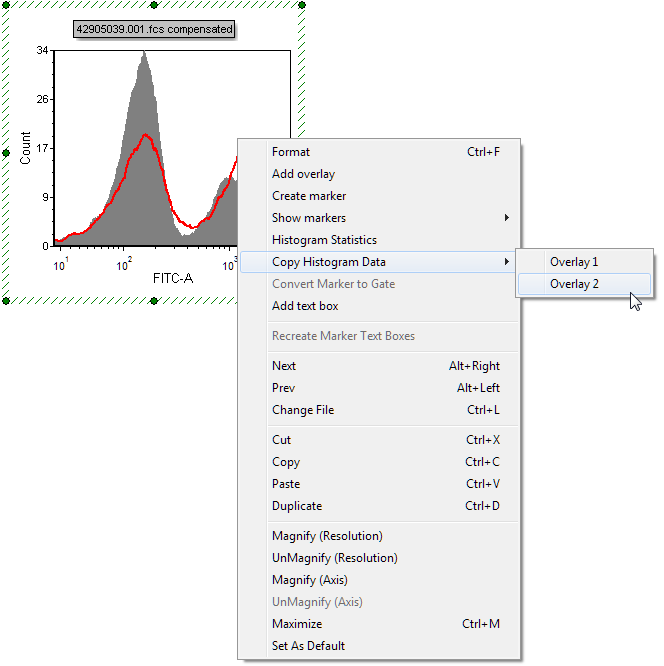
11. FCS Express
FCS Express by De Novo Software is a robust data analysis software specializing in flow and image cytometry data. It has a built-in histogram feature that allows scientists to visualize and analyze the cell populations in their datasets.
11.1 Pros
- Scientific Specialization: FCS Express is specifically designed for cytometry data, making it an ideal tool for scientists working in this field.
- Advanced Data Analysis: FCS Express offers a range of advanced data analysis tools beyond histogram creation, including statistical testing, gating, and cell cycle analysis.
- Comprehensive Support: De Novo Software offers extensive customer support, including webinars and one-on-one assistance, helping users to get the most out of the software.
- Data Collaboration: FCS Express has collaboration features that allow for easy sharing of datasets and analyses across a team.
11.2 Cons
- Highly Specific: Due to its focus on cytometry data, FCS Express may not be suitable for users working with different types of datasets.
- Cost: FCS Express is a premium software. The cost might be prohibitive for small labs or individual researchers.
- Complex Interface: As a scientific software, FCS Express offers exhaustive features which might seem complex to beginners or those not familiar with the specific field of cytometry.
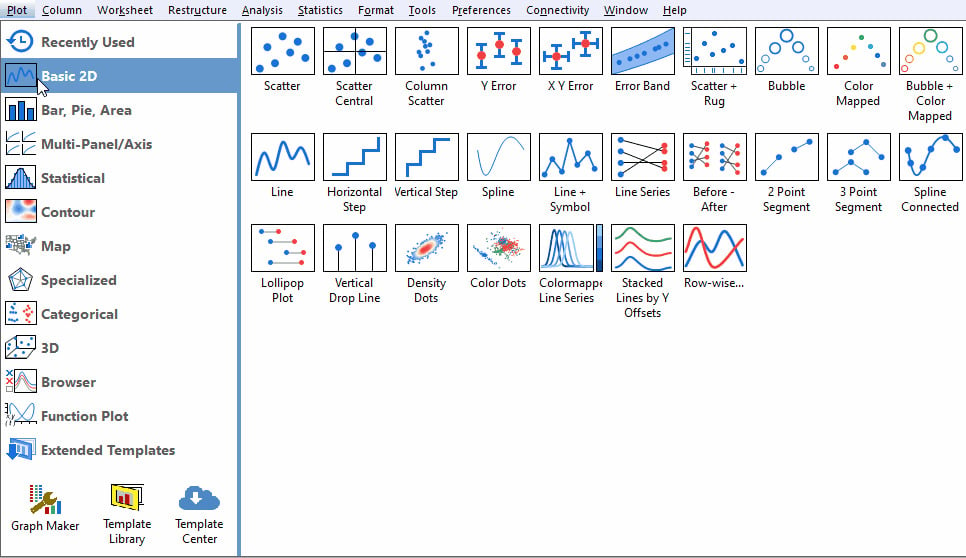
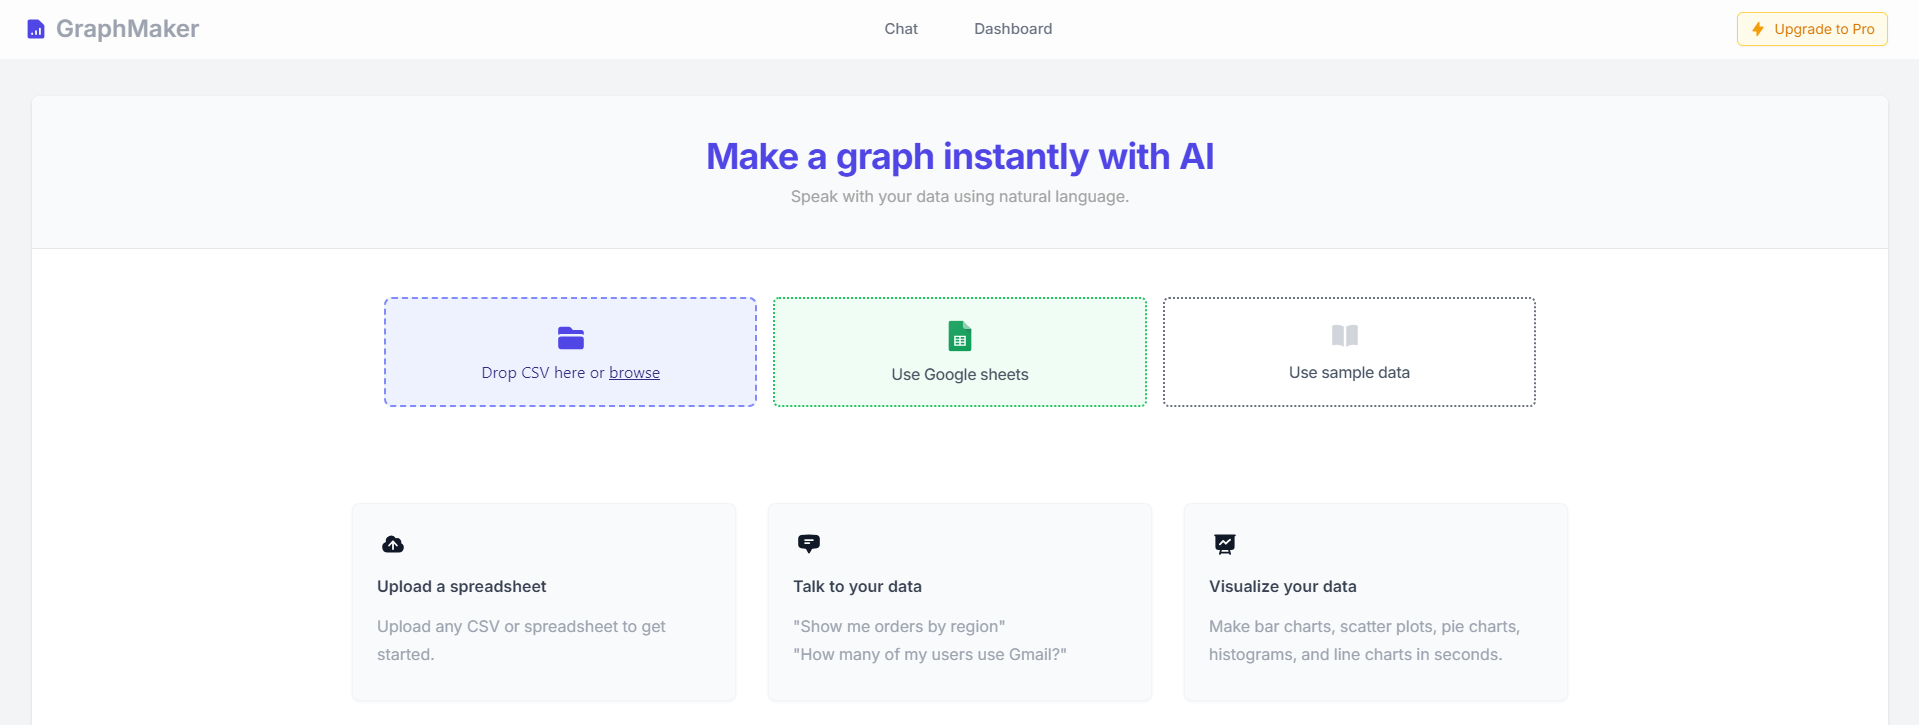
12. GraphMaker
GraphMaker is an online data visualization tool designed to take the pain out of creating beautiful, interactive charts, including histograms. With its AI-powered software, even users with no coding skills or design ability can make impressive, professional-grade charts.
12.1 Pros
- AI-Assistance: GraphMaker uses AI technology to assist users in making attractive and accurate graphs, taking the manual work out of the design process.
- User Friendly: GraphMaker’s interface is designed to be simple and intuitive, making it suitable for beginners.
- Interactive Charts: GraphMaker charts are not static, but interactive, allowing viewers to engage with the data by zooming, panning or clicking to view more details.
- Cloud-based: Being a cloud-based tool, GraphMaker graphs can easily be shared or embedded online, and accessed anywhere with an internet connection.
12.2 Cons
- Internet Dependent: As a cloud-based tool, GraphMaker requires a stable internet connection. Users working offline might face challenges.
- Limited customization: While GraphMaker offers ease of use, it may not provide the depth of customization options that other, more complex software might provide.
- No live data integration: At present, GraphMaker does not offer live data integration, which could limit real-time data visualizations.
13. Summary
13.1 Overall Comparison Table
| Tool | Features | Ease of Use | Price | Customer Support |
|---|---|---|---|---|
| Visme’s Histogram Maker | Interactive Histogram, Customization, Data import | Easy | Premium | Good |
| Someka Histogram Maker Excel Template | Automation, Compatibility with MS Office | Easy | Affordable | Good |
| QI Macros Histogram Maker | Improves Excel’s limitations, Quality tools | Easy | Expensive | Variable |
| EdrawMax Histogram Maker | Versatile, Customization, Multiple file formats support | Intermediate | Premium | Good |
| ZENPLOT | Multi-layer Plots, Wide range of graphs, Annotation | Complex | Premium | Good |
| ChartSmartXL | Excel integration, Template options, Automation | Easy | Premium | Good |
| Origin | Robust graphing capabilities, High precision measurements | Complex | Expensive | Good |
| Better Histogram Add-in | Automatic bin calculation, User-friendly Interface | Easy | Premium | Good |
| SigmaXL | Depth of features, Excel Integration, User-support | Intermediate | Premium | Good |
| FCS Express | Scientific Specialization, Advanced Data Analysis | Complex | Expensive | Excellent |
| GraphMaker | AI-Assistance, User Friendly, Interactive charts | Easy | Premium | Good |
13.2 Recommended Tool Based on Various Needs
Depending on the specific needs, the following recommendations can be made:
- For those familiar with Excel and prefer a simple, intuitive interface: Better Histogram Add-in or QI Macros Histogram Maker
- For those looking to create interactive histograms: Visme’s Histogram Maker
- For those in the scientific community, especially in the field of cytometry: FCS Express
- For those seeking for an AI-powered experience: GraphMaker
- For those with a need for advanced statistical and complex charting features: Origin or SigmaXL
14. Conclusion
14.1 Final Thoughts and Takeaways for Choosing an Histogram Maker Tool
Choosing a histogram maker tool depends on your specific needs and context. Each tool reviewed in this guide comes with its own set of strengths and potential shortcomings, suggesting that there is no ‘one-size-fits-all’ solution.

If you are well-versed in Excel and prefer to continue working in this familiar environment, Excel Add-ins like Better Histogram Add-in, ChartSmartXL, or QI Macros Histogram Maker could be ideal for you. For science professionals, especially those working with cytometry data, FCS Express brings a particularly tailored solution. If you are looking for innovative features like AI-assist or interactive charts, GraphMaker would be an excellent choice. For those needing advanced graphing capabilities and statistical tools, Origin and SigmaXL offer robust solutions.
Cost is another significant factor to consider. While some of these tools are available at a relatively high cost, they often come with advanced features and top-notch customer support. Nevertheless, there are also more affordable options available that still offer a decent range of features. Ultimately, the best histogram maker tool is the one that best suits your needs, balancing factors like ease of use, features, and price.
Author Introduction:
Vera Chen is a data recovery expert in DataNumen, which provides a wide range of products, including a great OST to PST conversion tool.